The effect of pressure and volume at constant temperature was first studied by Robert Boyle in 1662 which is known as Boyle’s law.
It states that “At constant temperature, the volume of given mass of gas is inversely proportional to its pressure”.
\[\text{i.e. } V∝ \frac{1}{P}\] \[V = \frac{K}{P} \text{ [K = Proportionality Constant]}\] \[PV = K \text{ ____(i)}\] Thus, the product of pressure and volume always remains constant.
Suppose, $P_1$ and $V_1$ be the initial pressure and volume of the gas respectively. Then, \[P_1V_1 = K \text{ ____(ii)}\] Similarly, $P_2$ and $V_2$ be the final pressure and final volume of the gas respectively. Then, \[P_2V_2= K \text{ ____(iii)}\]
From equation $(ii)$ and $(iii)$, \[P_1V_1=P_2V_2\] This equation is known as the mathematical expression for Boyle’s law.
Graphical Representation of Boyle’s Law
1. Plotting volume against pressure
When volume is plotted against pressure, a hyperbolic curve is obtained. It means that when pressure increases, volume decreases and vice versa.

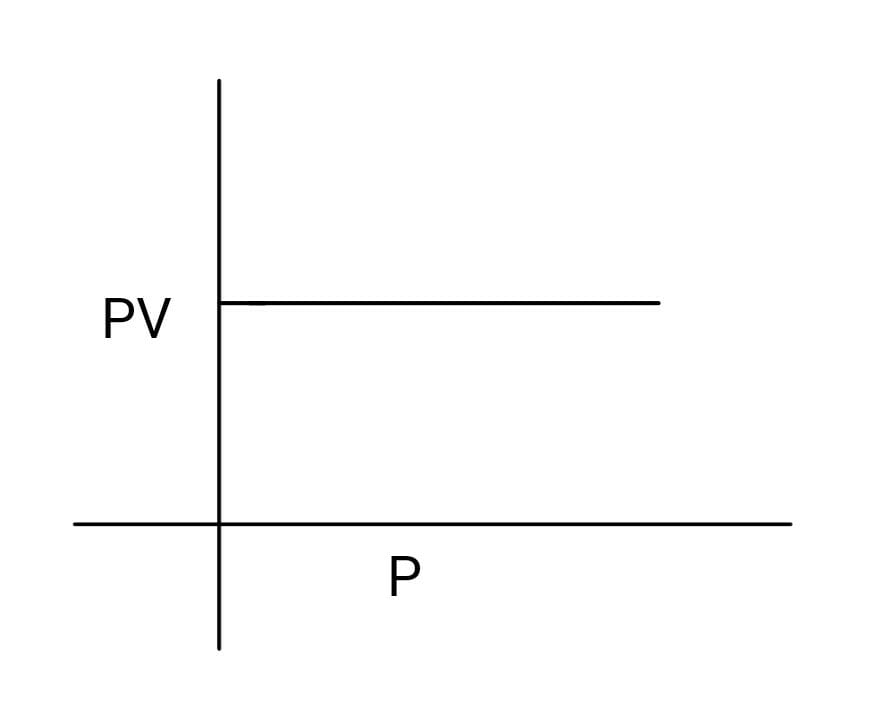
2. Plotting $PV$ against $P$
When product of pressure and volume is plotted against pressure, a straight line is obtained.
3. Plotting reciprocal of pressure against volume
When reciprocal of pressure is plotted against volume, a straight line is obtained in which slope can be calculated.
