Phase
Phase of an alternating quantity at any instant represents the fraction of time period that has elapsed since the current has passed through the zero position of reference. It is also expressed in terms of angle in radian.

In this sinusoidal waveform of instantaneous alternating current, the phase of the current at a point P is $\frac{T}{4}$ sec, where $T$ is the time period. The phase at the point P is also $\frac{π}{2}$ radian.
Phase Difference
Suppose there are any two alternating quantities, then the phase difference between them indicates the lagging or leading of an alternating quantity with respect to other.
A leading quantity is that quantity which reaches at any position earlier than the other quantity while a lagging quantity is that quantity which reaches later than the other quantity. If $A$ and $B$ are two alternating quantities such that the quantity $A$ lags $B$ by an angle $\phi$ then their equations are given below.
\[I_A=I_0\sin\omega t\]
\[I_B=I_0\sin(\omega t+\phi)\]

Here, $\phi$ is the phase difference between the two quantities and $\omega t$ and $(\omega t+\phi)$ are the phases of $A$ and $B$ respectively.
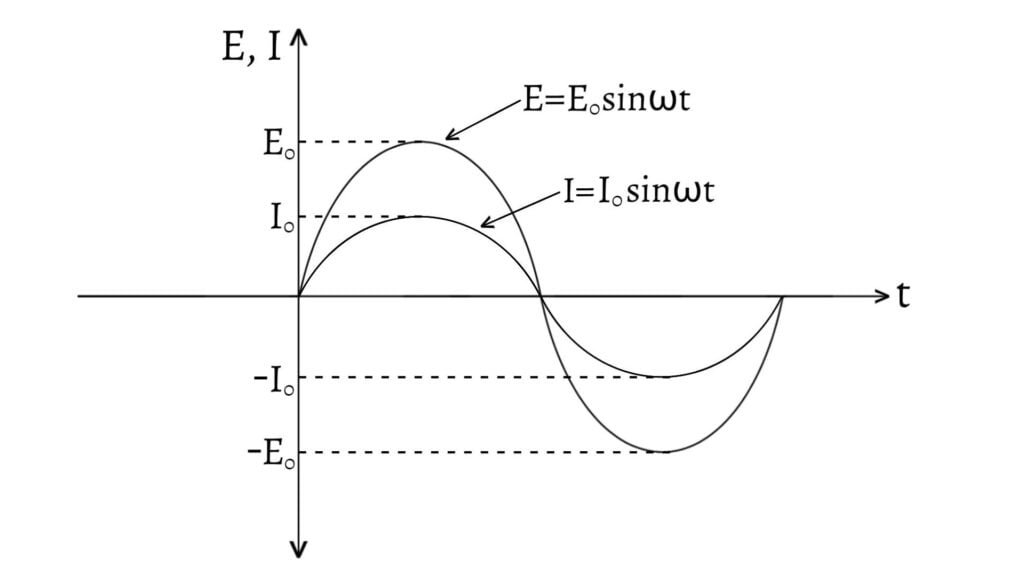
Two varying quantities are said to be in same phase if their maximum or minimum values occur in the same time. In other words, if the values of two varying quantities increase or decrease at the same time, then these two quantities are said to be in same phase. For such quantities, the phase difference is zero i.e. $\phi=0°$.
Suppose current and voltage are in same phase represented by,
\[I=I_0\sin\omega t\]
\[E=E_0\sin\omega t\]
Then, they are graphically represented as:

If the maximum values of two varying quantities occur in opposite directions, then they are said to be in opposite phase.
Phasor
The instantaneous current at any instant of time $t$ is given by,
\[I=I_0\sin\omega t\]
To understand what is happening in the circuit, we represent this sinusoidally alternating current by a line with arrow of definite length rotating in anticlockwise direction at a constant angular velocity. Such a rotating line is called a phasor.
Hence, a rotating vector used to represent a sinusoidally varying quantity with time is called phasor. A diagram representing these phasors is known as a phasor diagram. The length of the phasor is taken equal to the maximum value of the alternating quantity and its angular velocity equal to the angular velocity of the alternating quantity.
Consider an alternating current
\[I=I_0\sin\omega t\]
where, $I_0$ is the peak value of the alternating current and $f=\frac{\omega}{2π}$ is its frequency.

The line $OP$ of length $I_0$ rotates in anticlockwise direction about $O$ with uniform angular velocity $\omega$. This line $OP$ is called phasor. The projection $ON=O’P’$ on $OY$ at time $t$ is given by,
\[ON=OP\sin\omega t\]
\[ON=I_0\sin\omega t\]
If $OP$ is directed by the arrow in it as shown in the phasor diagram, then the projection $ON$ of the phasor $OP$ gives the value of current $I$ at that instant.
\[\therefore I=I_0\sin\omega t\]
Hence, the projection of phasor on OY-axis gives the instantaneous value of current $I$ at any instant and the angle made by the phasor with OX-axis gives its phase or phase angle i.e. $\theta=\omega t$.
If we plot the projections of the phasors $OP$ on $OY$ throughout the period $T$ or angle $\theta$ from $0$ to $2π$, then a sinusoidal ac wave varying with time $t$ is obtained. Hence, the phasor generates a sine wave or cosine wave. Phasor diagrams are useful in dealing with sinusoidally varying alternating quantities with same frequencies but different phases.
Previous: Root Mean Square (RMS) Value of AC
Next: Circuit Elements
